
Malware Using the Process Environment Block For Anti-Debugging

The Process Environment Block (PEB) is a structure contained within a Windows executable. It is used by the application to be able to access certain features for it to run smoothly. It contains information that is vital for a running process. It includes information such as if it is being debugged, the image base address, and list of currently loaded dlls. It contains multiple fields which can be used by malware to be exploited.
Malware Exploitation of the PEB
Since every process that is running on a Windows OS, will contain a PEB which can be accessed in user-mode, as opposed to Kernel mode. It is quite commonly used by malware to detect if it is actively being debugged or to use it to hide API’s it utilizes to help conceal its expected activity.
Malware analysts when reverse engineering malware, will commonly use a debugger to help determine and uncover hidden capabilities of malware. Malware will use anti-debugging techniques to check if it is running in a debugger and exit the process if it is.
Malware analysts will also make note of API’s that malware uses for several reasons. One is to get an understanding of what the malware might be capable of, setting breakpoints when a certain API is called by the malware to help speed up analysis and look to see what values may be getting used when calling a certain API.
For instance, if malware is creating a file, it could use the Windows API of “CreateFile”. One of the values that is used for that API is a parameter of lpFileName, which is essentially the file name that is going to be created. Malware might ‘hide’ APIs to avoid detection and make malware analysis harder to recognize the functionality and assigned parameters by using the PEB to map and reference an API’s location rather than simply calling the API’s name using plaintext (see ‘Dynamic API Mapping’ section).
The PEB address is stored in the register “FS:[30]” in 32-bit applications and “GS:[60]” in 64-bit applications. FS & GS are registers that point to the Thread Environment Block (TEB). The TEB contains a pointer to where the PEB is. The TEB is a gateway in an application to access the PEB, by the threads it contains. A table on Wikipedia about the TEB is in Figure 1.
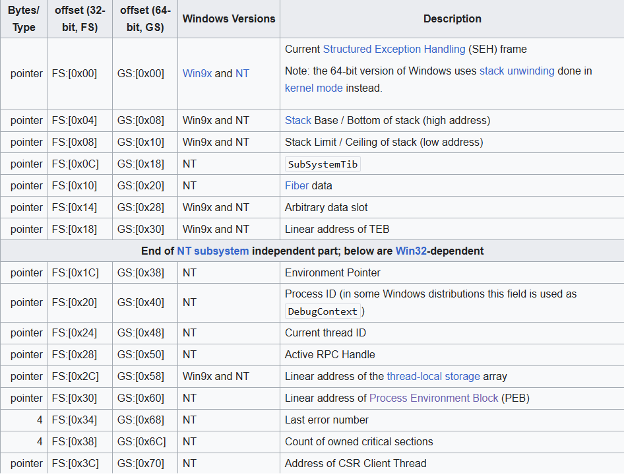
Figure 1: TEB table
In Figure 1 it shows that the Process Environment Block is in “FS:[30]” for 32-bit applications and “GS:[60]” in 64-bit applications. In the rest of this document will be referring to 32-bit applications when referring to the PEB.
Offsets within the PEB have certain values as shown below.
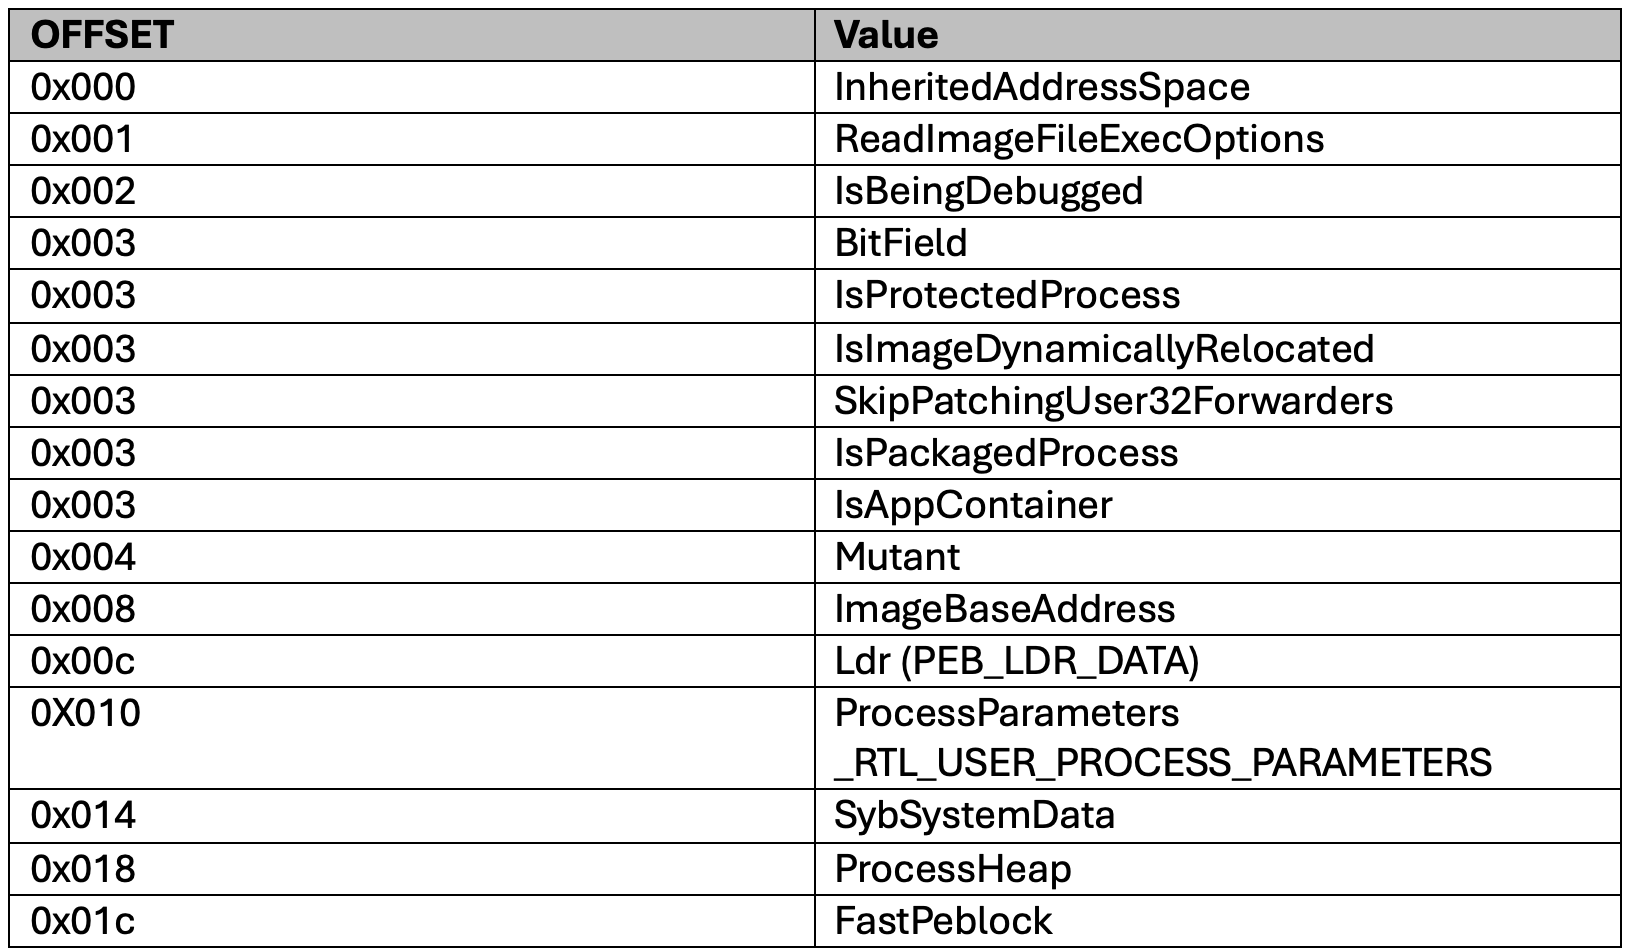
Figure 2 - PEB Offset
Common Flags Used by Malware
Here are some of the common flags from the PEB that are commonly used by malware to try and avoid being analyzed.
IsBeingDebugged (0x002): This is a field that will show if an executable is running inside a debugger.
NtGlobalFlag (0x068): This field contains information that can be checked to see if it is running inside a debugger. When a process is created running inside a debugger the following fields within NtGlobalFlag are additional fields which if set to 1 will indicate it is actively being debugged:
FLG_HEAP_ENABLE_TAIL_CHECK (0x10)
FLG_HEAP_ENABLE_FREE_CHECK (0x20)
FLG_HEAP_VALIDATE_PARAMETERS (0x4)
LDR Field (0x00c): This is a pointer structure that contains information about a process’s loaded modules. More information on how this can be used by malware in the “Dynamic API Mapping” section later in this document.
Process Heap (0x018): This is another field that can detect if a process is actively running within a debugger. It contains two additional fields of that will be triggered if it is running within a debugger. If the below fields are set to 1, it indicates it is currently running in a debugger.
Flags (0x40)
ForceFlags (0x44)
Anti-Debugging
To determine the address space where the IsBeingDebugged is in an application, would first need to determine the address the PEB is located. This can be easily done with Process Hacker, by looking at the Properties of a running application.
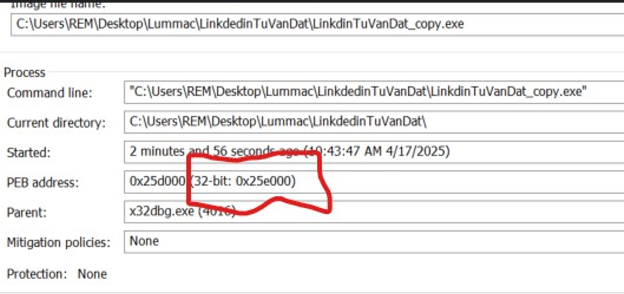
Figure 3 - Process Hacker showing location of PEB
If running in a debugger it can be found by running the associated commands to locate the PEB. Each debugger has a different command structure to determine the location of the PEB. For this document was using x32dbg which to locate the PEB address is “peb()”.
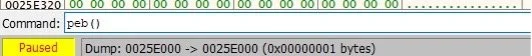
Figure 4 - Locating PEB in debugger
Both the Process Hacker and x32dbg show the address of the PEB at 0x0025E000. Using this address can view the bytes that are in the PEB and the associated offset. The location for IsBeingDebugged would be located at 0x0025E002.

Figure 5 - PEB Memory Location
As noted in Figure 5 the location of 0x0025E002 holds the value of “01”, indicating that this the application is being actively debugged, which it is inside x32dbg. Using a plugin can hide from the executable that it is running inside a debugger. After making the change note how the address of 0x0025E002 changed to “00”.
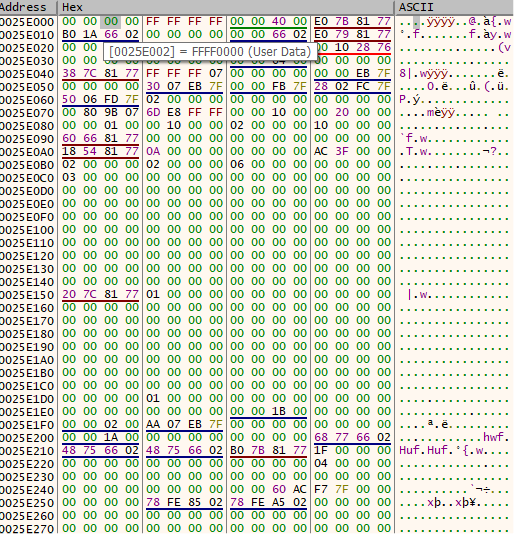
Figure 6 - Debugger hidden
Dynamic API Mapping
Dynamic API mapping is a technique for malware to hide what Windows APIs. This method is an anti-analysis technique to hide its APIs from an analyst. Malware analysts during static analysis will look to see what APIs are found in the PE to try to help determine the functionalities of the specimen. This technique can also hide the APIs used from some malware analysis tools such as “API Monitor”, which is a tool that lists APIs that are used during dynamic analysis. Hiding the use of calling APIs by their name also makes it difficult to debug a sample by placing a breakpoint when a certain API is called.
To perform dynamic API mapping malware will use the PEB to determine the location of the Ldr (Loader). Ldr contains the location of the modules (dlls) that are to be handled in a running process.
Within the Ldr there are three fields that can be used by malware.
InLoadOrderModuleList: Maintains the address of the modules as they were loaded into the process.
InMemoryLoadOrder: The loaded order for modules in memory
InInitializationOrderModuleList: The order the modules were initialized.
What is a list of modules that are also being used by a process. What makes this list important for malware is that these lists also contain location of a forward pointer (flink) and backward pointer (blink) for the modules used by the executable.
To simplify if malware wants to map certain APIs from a dll, it will first need to find the address of the dll as it was loaded into the running process. It does this by going through one of the Ldr fields, either InLoadOrderLinks, InMemoryOrderModuleList or InInitalizeOrderLinks. The offset for InLoadOrderLinks, InMemoryOrderModuleList or InInitializeOrder links is listed in Figure 7. To find the location of the dll it is looking for. Once this is found it will use a hashing algorithm to find the API that it would like to use from that dll and load it into memory.
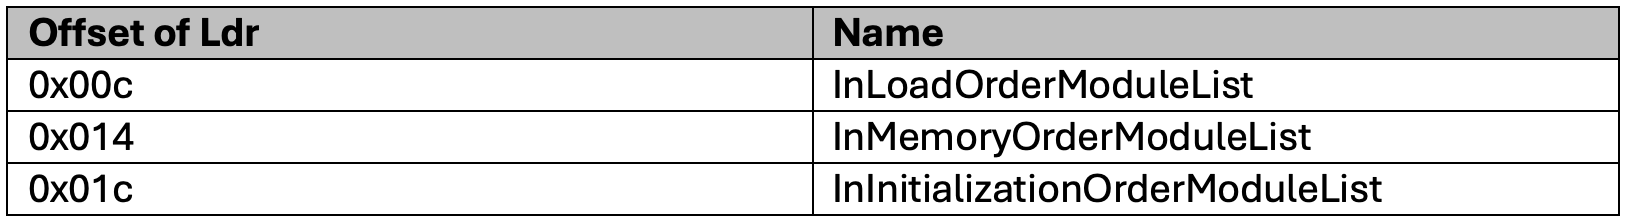
Figure 7 - Ldr Module List offset
As listed in Figure 7 above, the Ldr is located at 0x00c in the PEB. In images 8-9 below show the mapping of FS:[30], the PEB into the register EAX. At location 442F0F the value of ESP+4, which contains the value of 30 is moved into the register eax. At 442F13 the value of FS:[eax] is then moved into the register eax.

Figure 8 - Value of EAX

Figure 9 - Moving FS:30 into EAX
The sample will move the value of eax plus 0xc into the register edx. The purpose of this is the address of eax contains the address of the PEB. Adding the hexadecimal value of 0x00c to the address of the PEB will give the location of the Ldr. It then adds 0x00c again to edx to provide the offset of InLoadOrderModuleList to the register.

Figure 10 - Loading InModuleMemory into registry
Once this is completed it will look up the values that are in the InLoadOrderModule into a register to be used later. The malware will also move the value of the dll that it is looking for to be compared into another register.
In Figure 10 we see that it is moving the value that is currently from esi+30 (address space from current InLoadOrderModuleList) into the ebx register. Also see that it is moving the value of esp+24 (value of the dll it is looking for into the register ebp). It may go through this loop a few iterations until it finds the value that it is looking for. Figure 11 shows the value of the registers once it moves the InLoadOrderModule value into ebx.
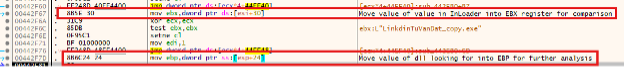
Figure 11 - Comparing value of InLoadOrderModule to dll to start mapping

Figure 12 - EBX & EBP registers
The code will then go to a loop, where it will check the values of what is in ebp & ebx registers. In Figure 12, it will move the byte value of ebp into ecx register. To verify that it is not a capital letter, by moving ecx-41 into edx and comparing that to the value of 1A.
1A is the hex value of the first capital letter, when converted to ASCII, the letter “A”. The lower-case letters start with the hex value of 61. If it is a capital value, ecx will be xor’d with 20, to make it a lower case.
This is shown in the addresses for this executable 442F90-442FA6 in Figure 12.
After the values are verified to be using the same lower case, they are compared at address 442FBA. If they are equal, it will continue the loop until the comparison is complete.

Figure 13 - Comparison loop
This will provide the location where the dll is loaded into memory. Which in this case is the value of ntdll.dll. This is done by moving the value of esi+18 (InLoadOrderModule into eax. This is pushed onto the stack.

Figure 14 - Pushing address of ntdll.dll

Figure 15 - EAX register with ntdll address
Looking at the address location of the loaded libraries, can verify that ntdll.dll is loaded at address 77700000 (NOTE: ASLR is disabled on this piece of malware for easier analysis).
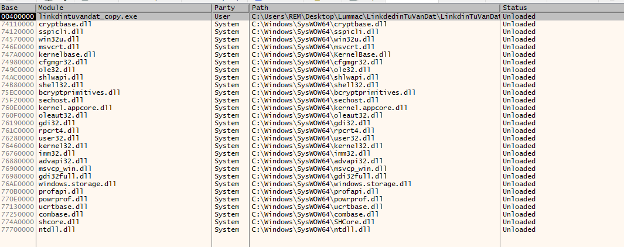
Figure 16 - Address location of libraries
The address location of “ntdll.dll” is then pushed into data address location of 4584f4.

Figure 17 - Mapping value into address location
Further in the code when stepping through it will produce a function, renamed by the analyst as Identifier. In this it will push a unique value onto the stack along with the value of addresses.
Next step is to identify what APIs are that the dll has. The malware will look through the dll and identify what APIs are part of the dll. It will also calculate the length of the API name. This is done to be able to identify the name of the next dll.
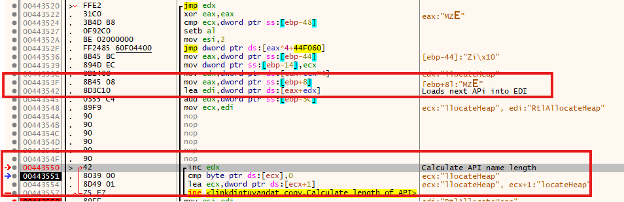
Figure 18 - API identification and length
At address 0x443542 see that the value of eax and edx is moved into edi. The value of edi contains the name of the dll that is being identified. In this example, while not shown edi has the address of 0x778a7c4, which contains the value of “RtlAllocateHeap”. As noted in Figure 18, the list of APIs within the dll are listed alphabetically.

Figure 19 - APIs listed alphabetically.
Later in the code it will load the value of where the code section of the API is located into EAX for future reference. For this sample of the API of “RtlAllocateHeap” is moved into the register eax. The location of the API is 0x777413b0.

Figure 20 - Moving address location of RtlAllocateHeap
This can be verified by looking at the symbol’s location of ntdll.dll.

Figure 21 - Symbols section address of RtlAllocateHeap
Once the API that is intended to be dynamically mapped is identified and the address is located the function will proceed to exit. If the API is not one intended for use, the function identified by the analyst as identifier will continue to loop.
At this point, the value of eax contains the address location of the intended API. It then is mapped to a data location. Figure 22 shows eax being moved into the address space.

Figure 22 - EAX moving RtlAllocateHeap into memory location
Can see the next few called functions looking to dynamically place the address of APIs that the malware will use. In Figure 23, we see the values of the function identifier. In the mov after each call to the “Identifier” function it is showing the location of the data label.
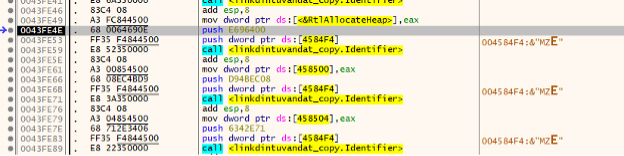
Figure 23 - Identifier function being called
Figure 24 shows the values of the data labels in a debugger after stepping over the identifier function.
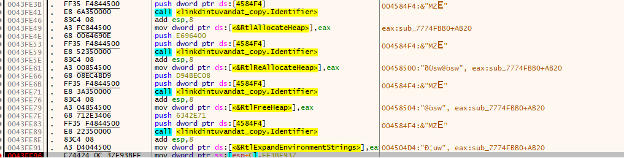
Figure 24 - Values of data labels
Using xrefs for the address of RtlAllocateHeap, can see two entries. One is when eax is moved into the location. The other is moving the address of RtlAllocateHeap into the value of ebx.
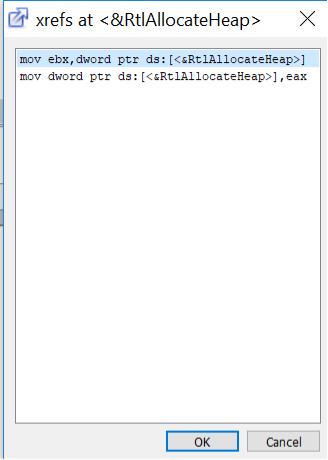
Figure 25 - Xref to address where RtlAllocteHeap
Clicking on the value of the “mov ebx, dword ptr ds:[<&RtlAllocateHeap>]”, bring you to the address location of this instruction. In this case it is 0x43dc05, and later in the code at address 0x43dc1c there is a call to ebx. Which will call for the API “RtlAllocateHeap”.
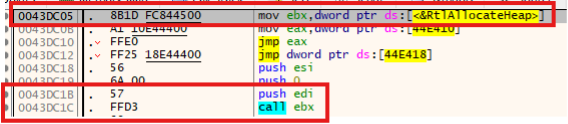
Figure 26 - Calling rtlallocateheap